News
Three WildCRU Panthers excel, and help save leopards and tigers
David Macdonald reports on the incredible achievements of graduates of WildCRU’s Recanati-Kaplan Centre’s Diploma in International Conservation Practice. Amongst our diploma students, (we call them WildCRU Panthers) in 2010 Lhendup Tharchen from Bhutan was a star, in 2012 Leandro Abade from Brazil similarly shone, and in 2014 Susana Rostro-García twinkled brightly in our firmament. How wonderful that our most recent paper http://link.springer.com/article/10.1007/s10980-015-0335-9, entitled “Scale dependence of felid predation risk: identifying predictors of livestock kills by tiger and leopard in Bhutan”, is co-authored by all three of them!
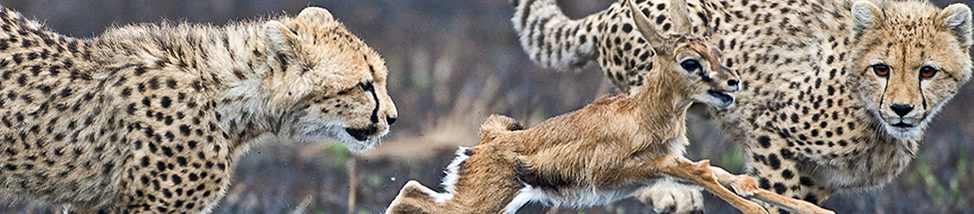
Livestock predation, one of the main drivers of human-carnivore conflict in Bhutan, has increased in recent years across the country, with tiger and leopard killing significantly more livestock than any other carnivore species. We know this because Lhendup, having graduated from WildCRU, is now working for the Department of Forest and Park Services, and had gathered a remarkable dataset on conflict between these big cats and farmstock. Clearly when livestock are killed by tigers or leopards it can be disastrous for the local people. Our team, led by Susana, had the idea that if these big cats were repeatedly killing stock in the same sort of landscape (for example, because it was easy to kill them there) then identifying the features associated with where predators had killed stock would enable us to predict where they were likely to make kills in future, enabling us to advise better on how to stop it happening. We hoped for a virtuous circle, reducing the number of kills, thereby reducing retaliatory killing and fostering the species’ conservation. The aim of our study was to identify the landscape (i.e. environmental, geomorphological, and anthropogenic) features that predict livestock predation by tiger and leopard throughout Bhutan.
We used livestock kills obtained from compensation records of tiger and leopard across Bhutan between 2003 and 2012 to run computer models predicting the risk of future attacks (for the technically minded, we did this using MaxEnt algorithm, and a multi-scale modeling approach). Human-presence (density of settlements and roads) and land-cover (percentage of tree cover and meadow patches) were the best predictors of livestock kills by both species, and these varied with scale – that is, the size of area we considered. For example, at a fine scale (i.e., 1–4 km), density of settlements contributed most to predicting livestock kills by both tiger and leopard, whereas at a broader scale (i.e., 8 and 16 km), different land-cover types predicted livestock vulnerability to tiger and leopard kills. This shift in the predictors’ importance at different scales suggest that both tiger and leopard use the landscape differently at different scales – this is the sort of subtlety of ecological processes that scientists trying to understand wildlife conflict need to take into account
Risk maps revealed different hotspots for tiger and leopard kills, and that both species preferentially killed horses and donkeys over other livestock types. Our priority is to reduce livestock kills by tiger and leopard in Bhutan, and suggest practical solutions to help the villagers achieve this. This is especially important in Bhutan because the country is home to significant populations of globally threatened big cats, and livestock raising is central to the livelihoods of most Bhutanese people. We have been delighted to keep the local wildlife authorities informed of our findings; to explore how we can best help them we participated in a workshop focusing on both national and regional targets for reducing livestock predation while fostering big cat conservation.
Figure 1. Predicted risk of leopard kills on livestock across Bhutan (a logistic output, b raw output). The colour gradient indicates livestock vulnerability, with warmer colours representing the areas in which kills are most likely to occur. The risk of predation is shown for the different districts.
(a)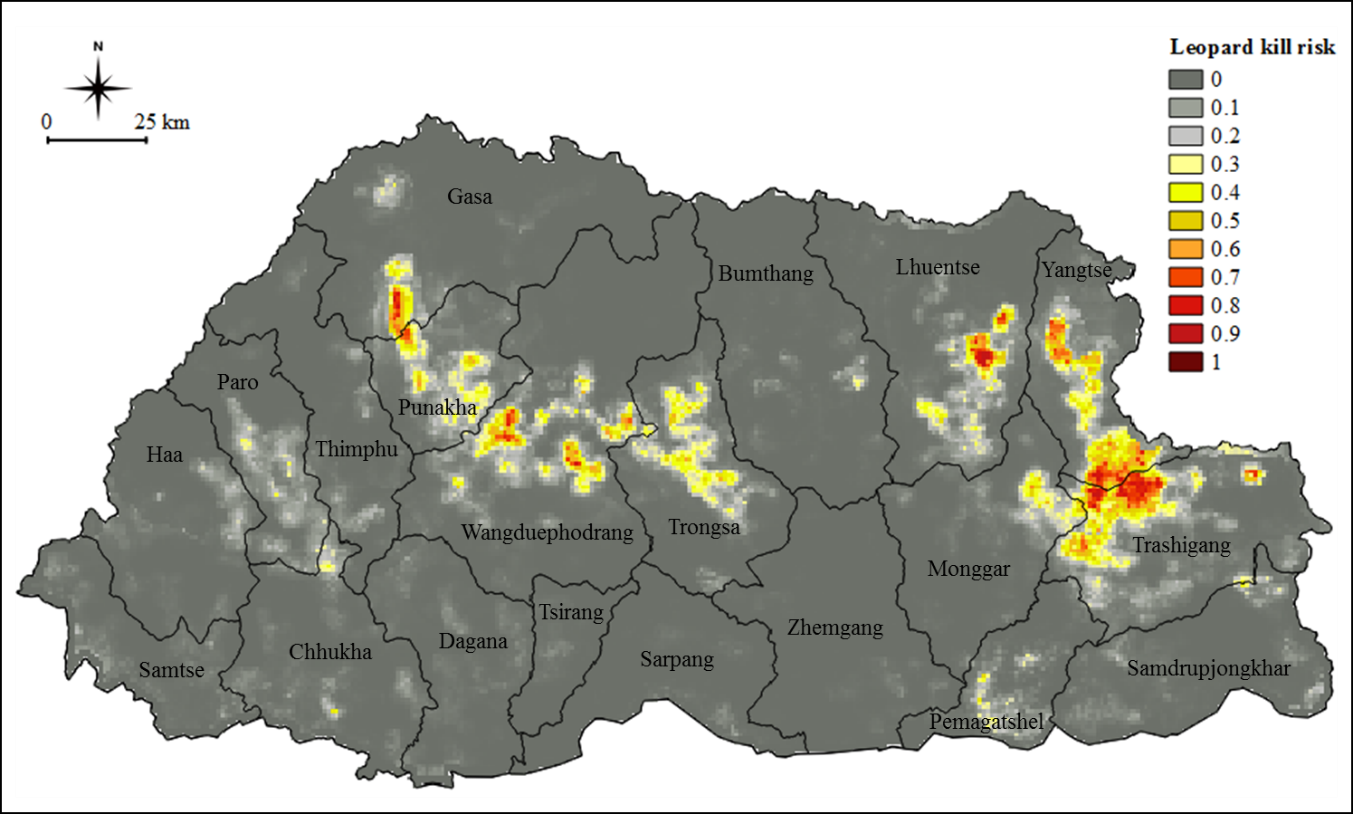
(b)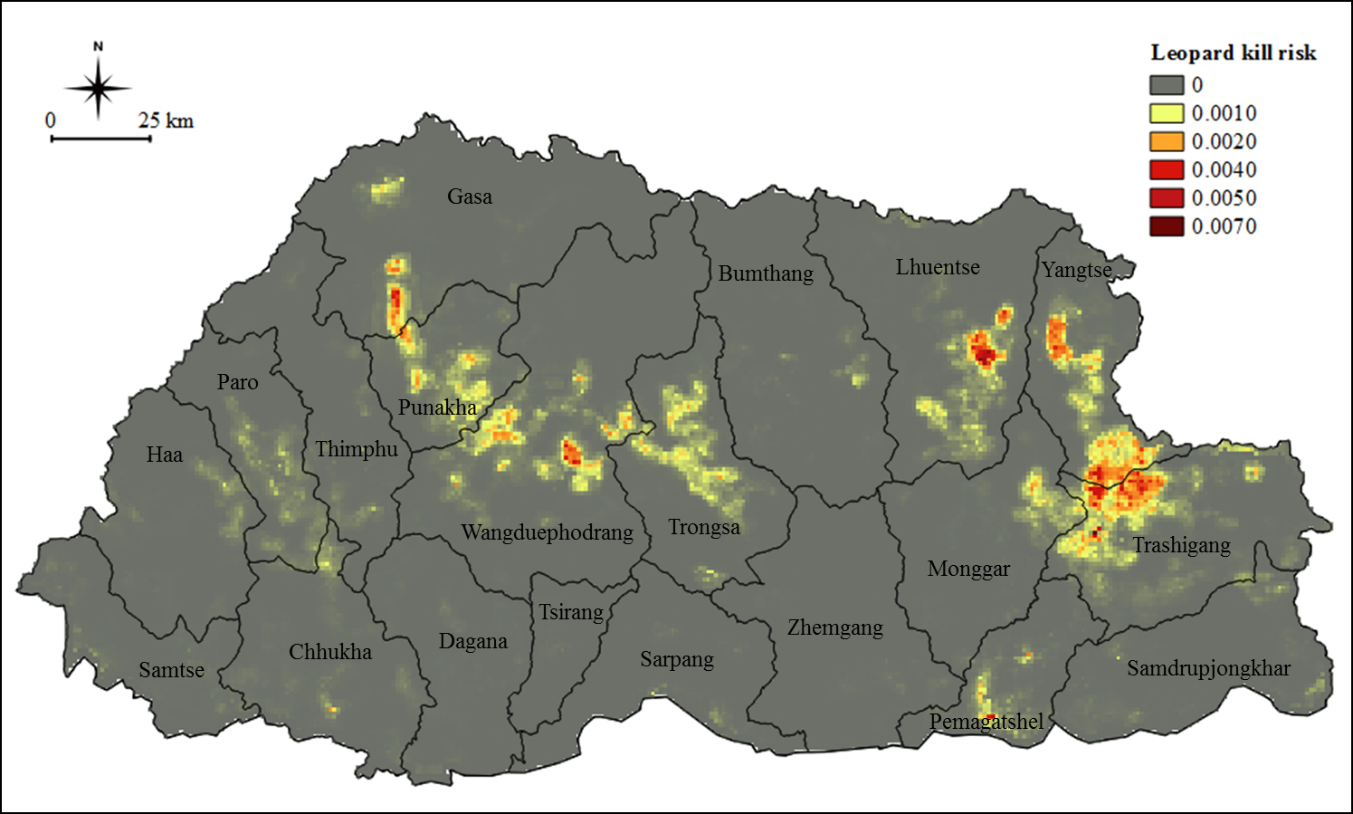
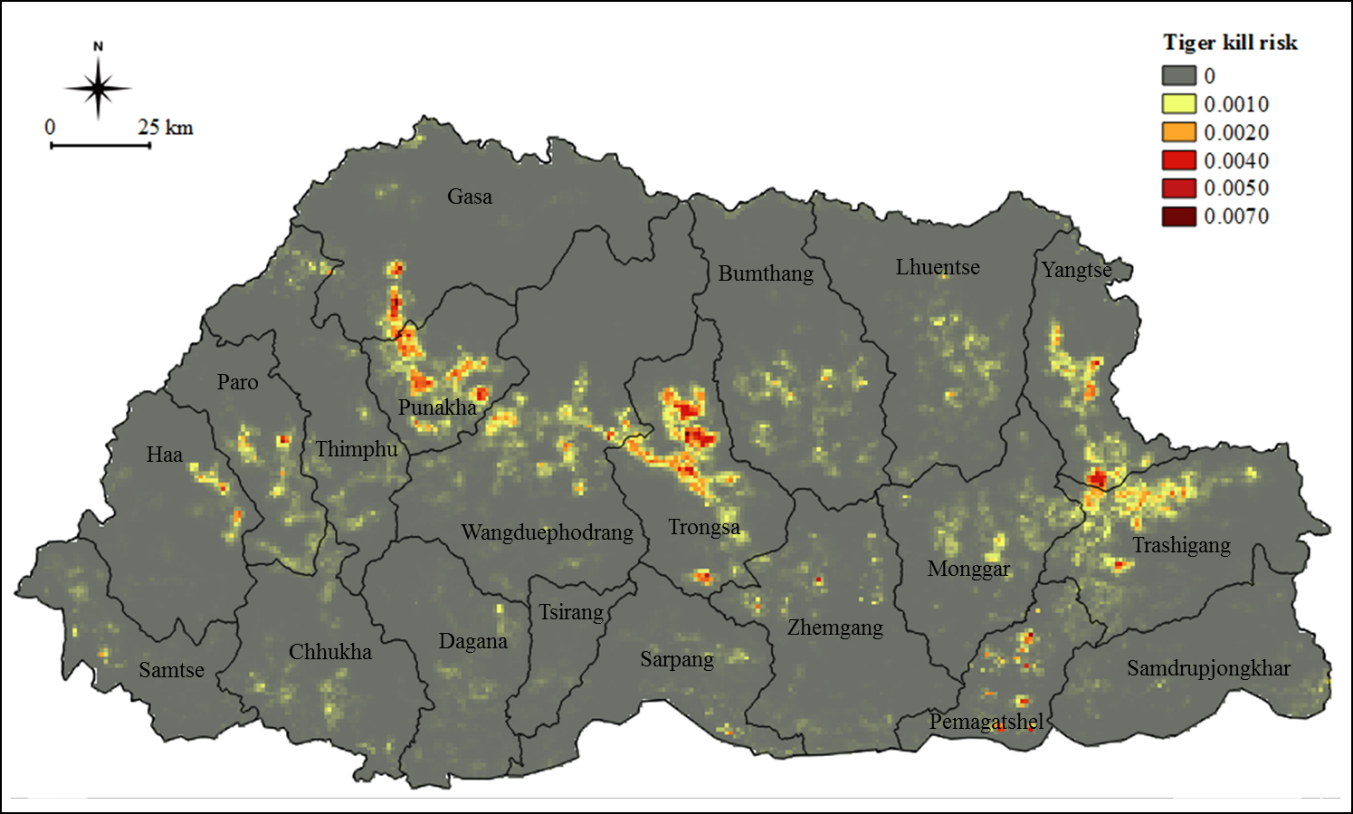
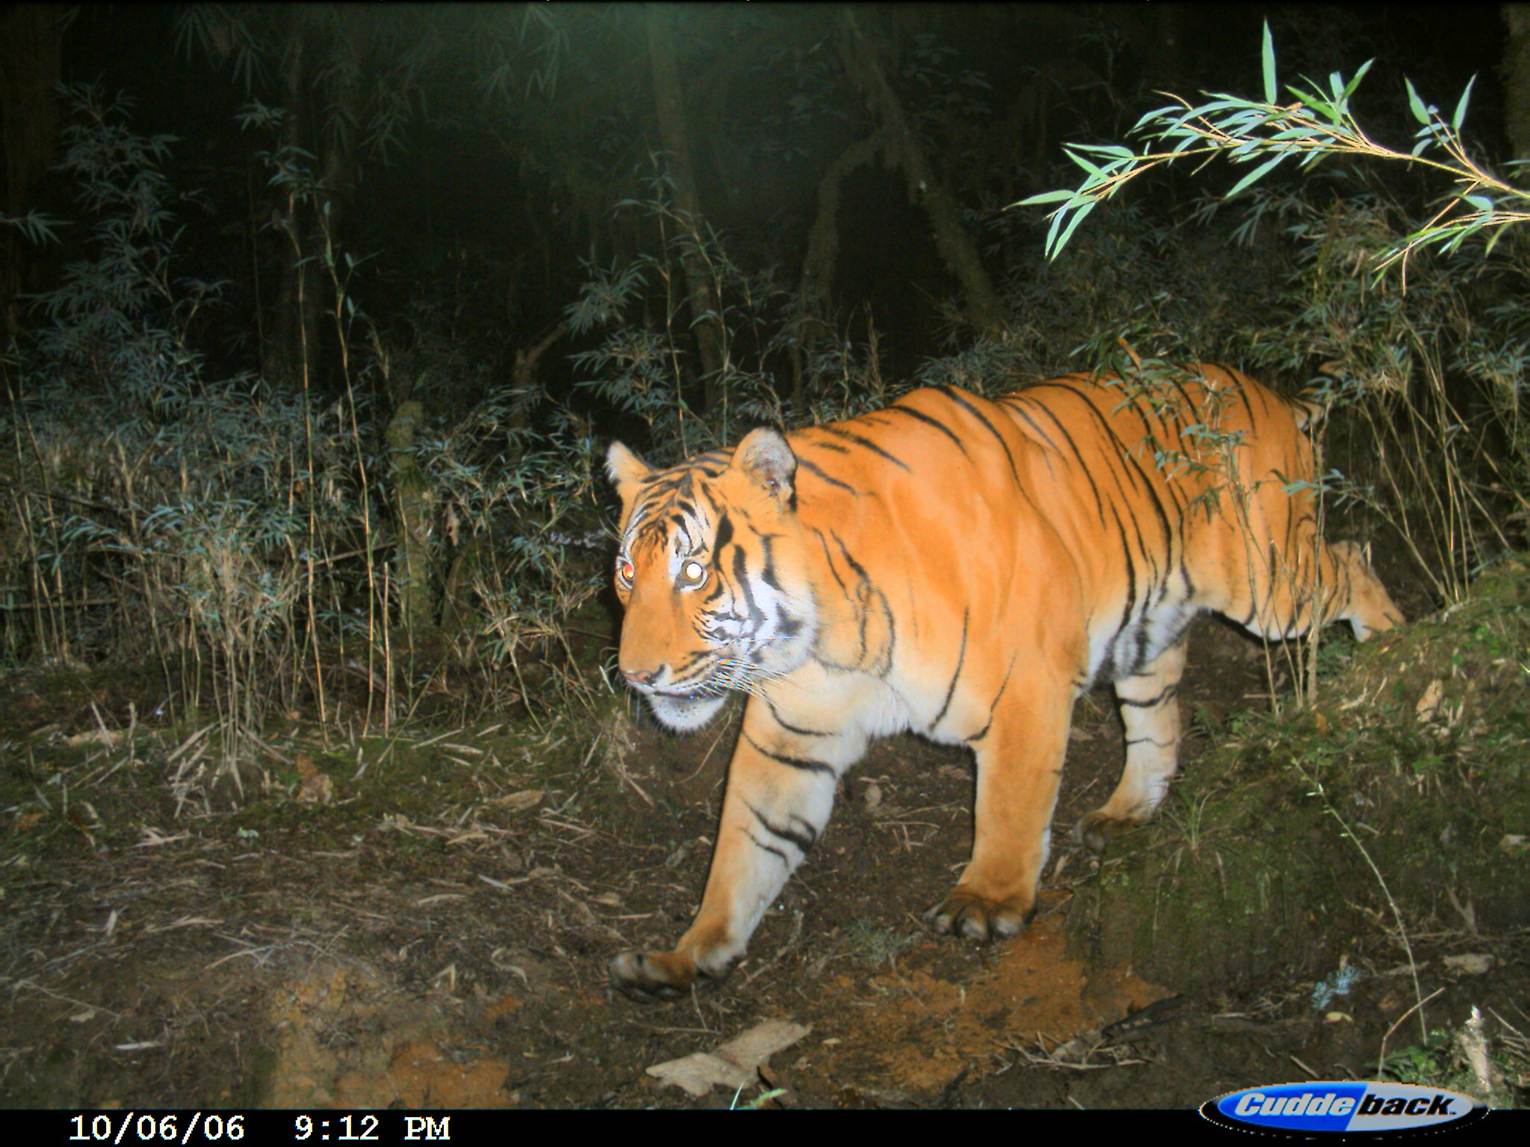
Figure 2. Predicted risk of tiger kills on livestock across Bhutan (a logistic output, b raw output). The color gradient indicates livestock vulnerability, with warmer colours representing the areas in which kills are most likely to occur. The risk of predation is shown for the different districts.
(a)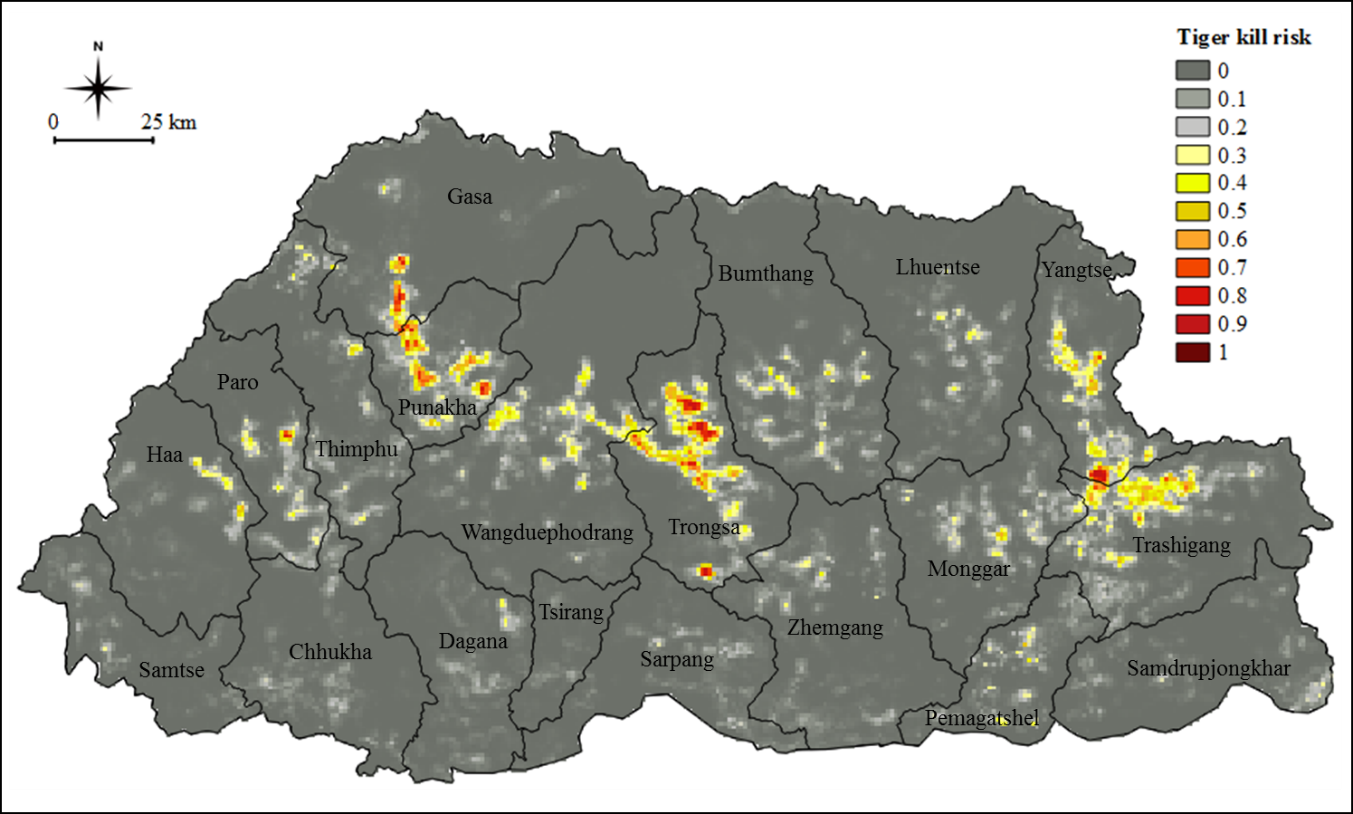
(b)