

News
Open access data on East Africa’s rangelands
Rangelands cover more than 30% of the world’s terrestrial surface, supporting billions of people and
nearly half of all livestock, and sustains biodiversity and vital ecosystem services. Yet many
rangelands are undergoing radical social and ecological transitions. The upcoming ‘UN Decade of Ecosystem Restoration‘ aims to prevent, halt, and reverse the degradation of
ecosystems worldwide. The question is how do we monitor the degradation of rangelands
and their drivers?
As part of Peter Tyrrell‘s DPhil work, he worked with 17 organisations and 32
authors, to collate spatial data covering 30,000 km2 of southern Kenya’s rangelands. This
includes documenting 31,000 livestock enclosures, nearly 40,000 km of fencing, and 1,500
km2 of agriculture. Southern Kenya is one region that still hosts pastoralist social-ecological
systems in which the rangeland is shared with a high abundance and diversity of large
mammals. However, these systems face profound degradation due to widespread
agricultural expansion, sedentarisation of pastoral people, and accelerating fencing, which is
fragmenting ecosystems and threatening their sustainability.
The data is open access and is documented in Nature Scientific Data. Thanks to the support of the Mara Elephant Project the data is updated and accessible via ArcGIS Online. This data is rapidly being used in both local policy development and in science. This data helps inform land-use and ecosystem planning in multiple ecosystems, assess the viability of shrinking wildlife corridors, and document the impact of these changes on rangeland health. Increased collaboration within the scientific community, through data descriptor pieces like this, allow for the appropriate credit to be given to those who have worked hard to collect the data, while ensuring the data is made available to those who need it.
-
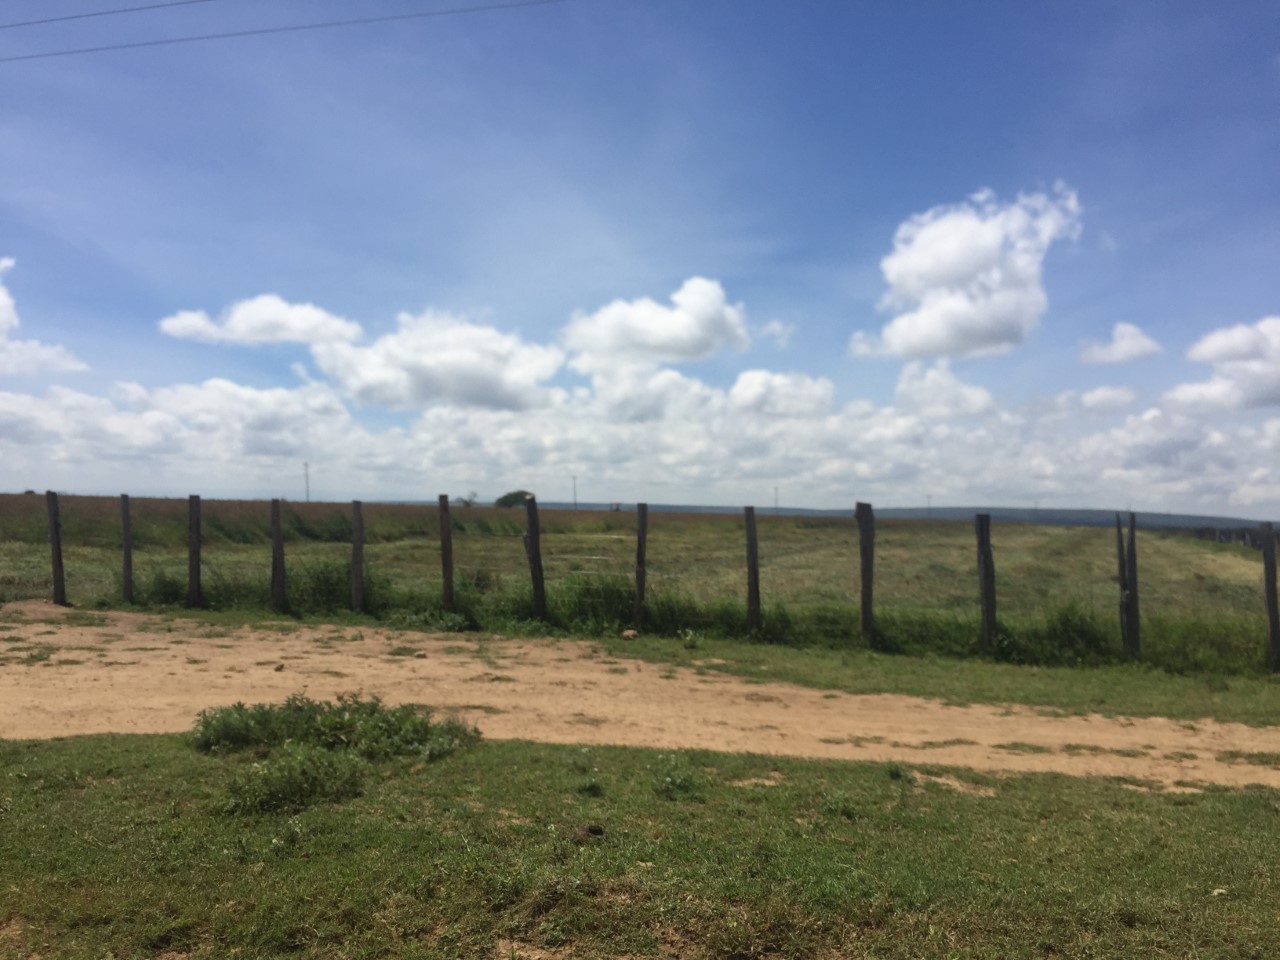 Example of a wire fence in the Maasai Mara, chequerboarding the ecosystem and halting the world-famous wildebeest migration
 -
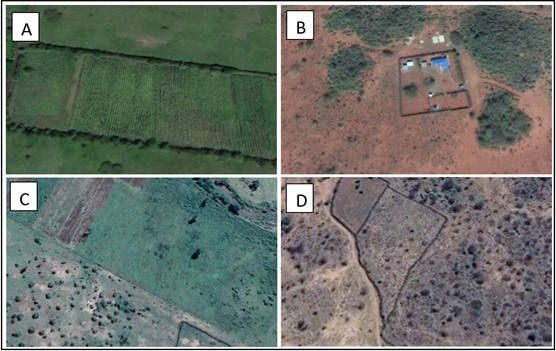 A figure from the paper demonstrating the different types of fences visible from satellite imagery in the region
 -
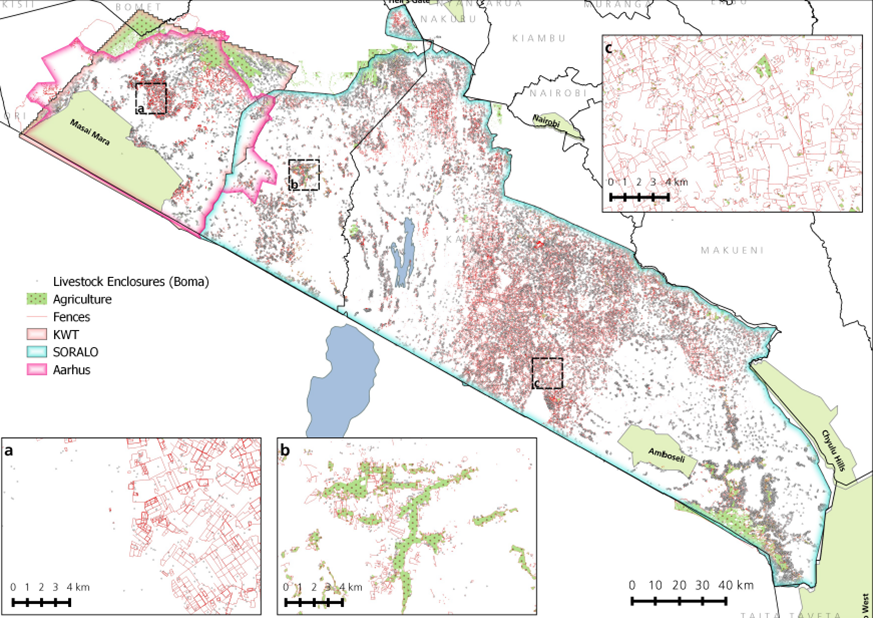 A map of the data collected in the database, covering 30,000km2 of southern Kenya with a data-set of over 40,000 km of fences, 30,000 bomas, and 1500km2 of agriculture