News
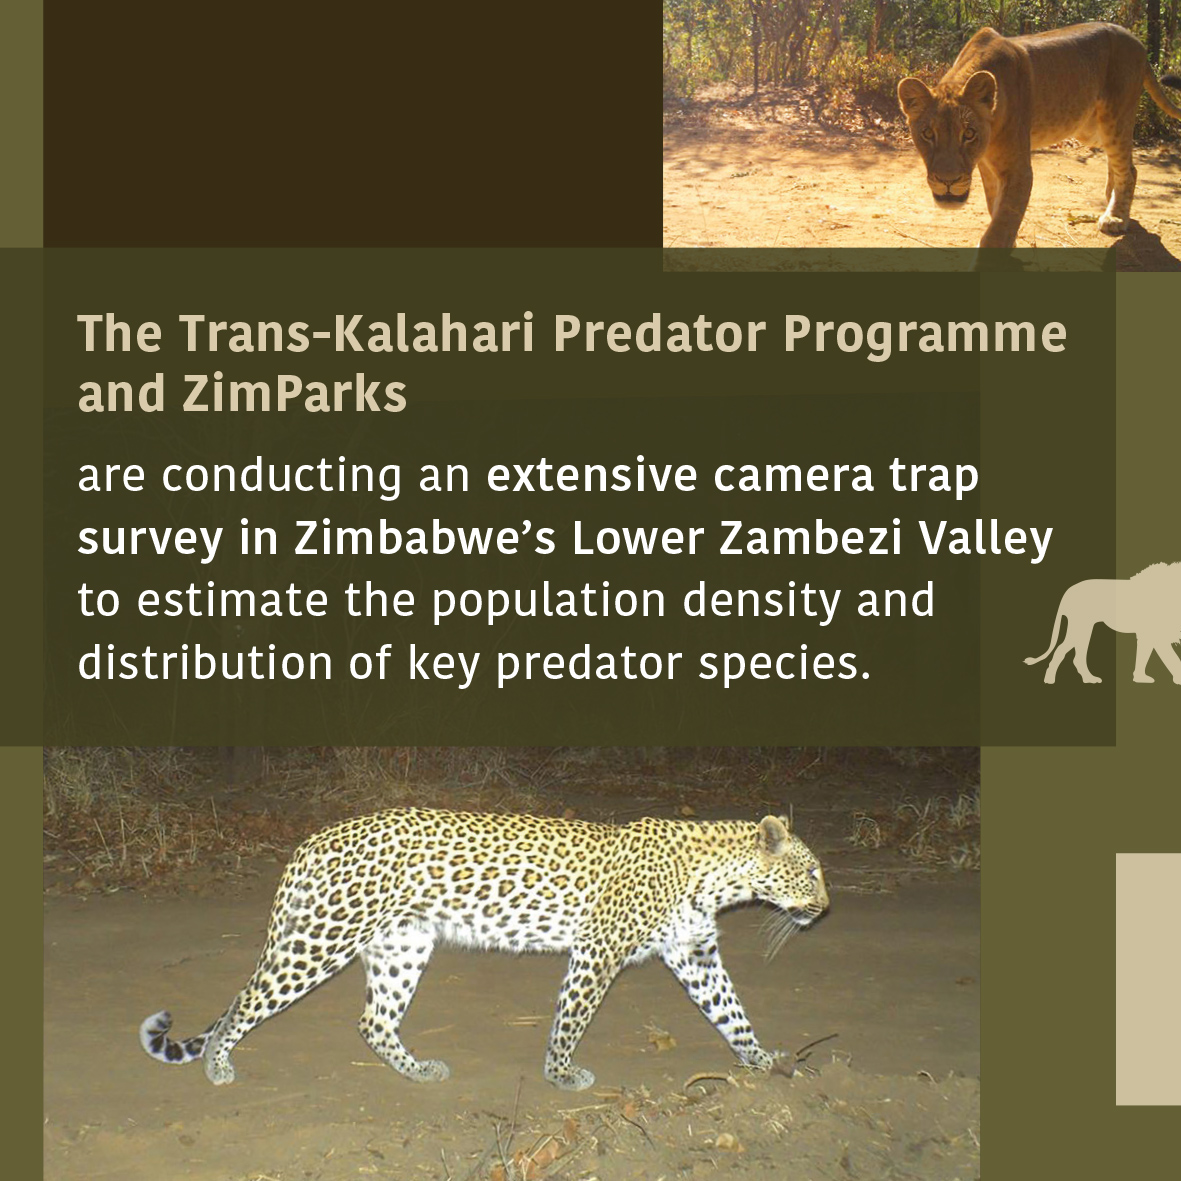
Establishing baseline wildlife population data in Zimbabwe’s Lower Zambezi Valley
WildCRU’s Trans-Kalahari Predator Programme, in close collaboration with Zimbabwe Parks and Wildlife Management Authority (ZimParks), is conducting an extensive camera trap survey in the Lower Zambezi Valley to estimate the population density and distribution of key predator species.
This is a vital landscape connecting southern and East Africa. Much of the area is currently pristine natural habitat, bounded by steep escarpments and protected areas in Zambia and Zimbabwe. The whole region has high cultural and environmental value, but there are significant threats to its biodiversity.
The camera trap survey is part of biodiversity assessment efforts aiming to better understand and address these threats, and ultimately inform conservation management plans. In combination with sighting records and night call-ups, essential baseline data is being collated against which wildlife populations can be monitored. While carnivores are the programme’s main research focus, a huge amount of data is being collected on other species, giving additional invaluable insight. 38 mammal species have been detected so far.
Multiple rolling camera trap grids are being used, covering a total area of ~8000km2. Camera trap stations are spaced 4-5kms apart – an optimal distance for effective detection of large and medium sized carnivores. This method allows comparison with previous surveys conducted across Zimbabwe and other countries. All images captured during the survey are uploaded to TrapTagger, an open source Artificial Intelligence platform designed to rapidly process and classify camera trap images according to species. Once the software has automatically tagged all images, the species classifications are checked to ensure that any errors in identification are corrected.
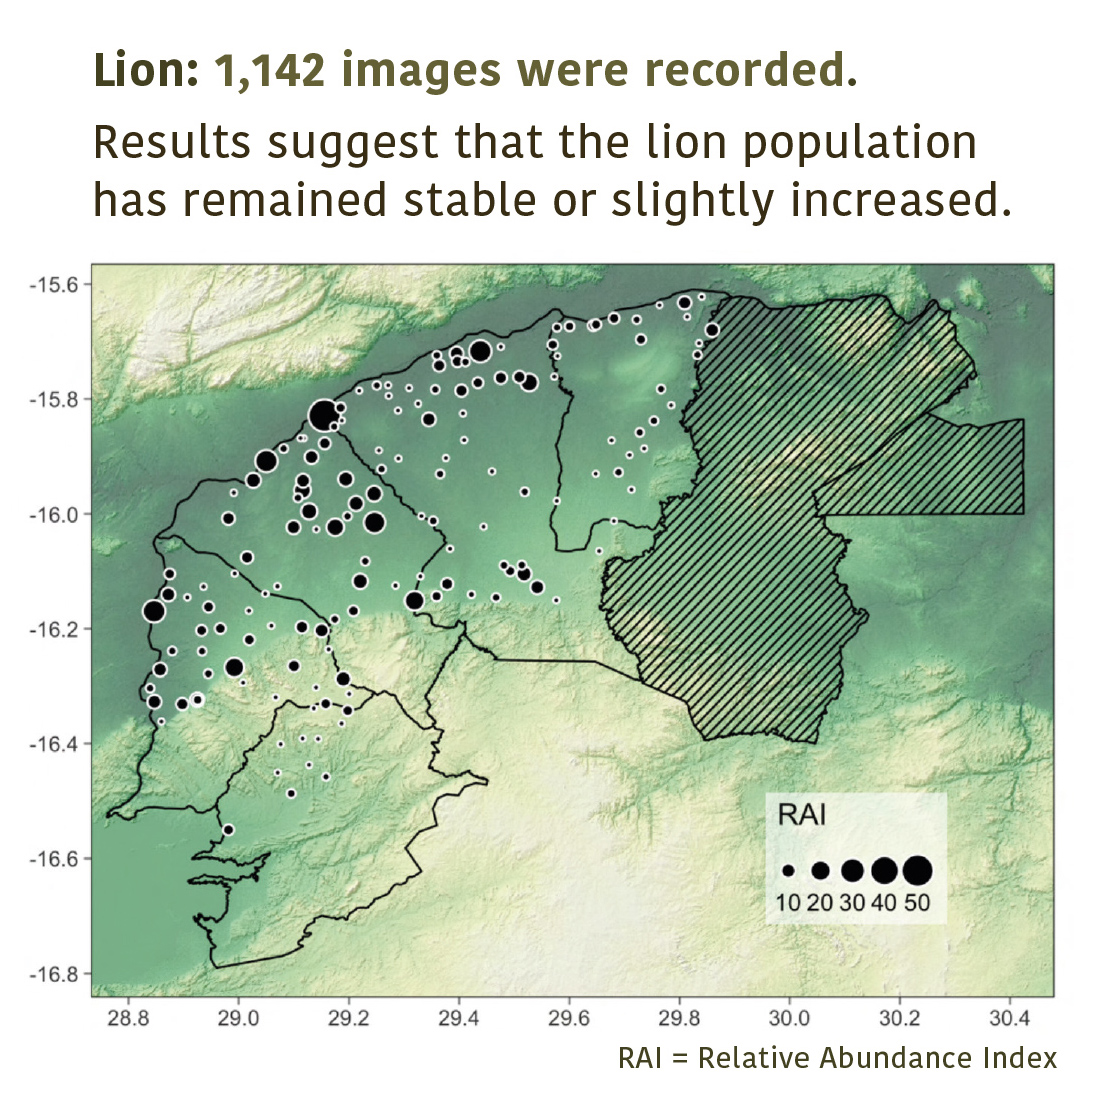
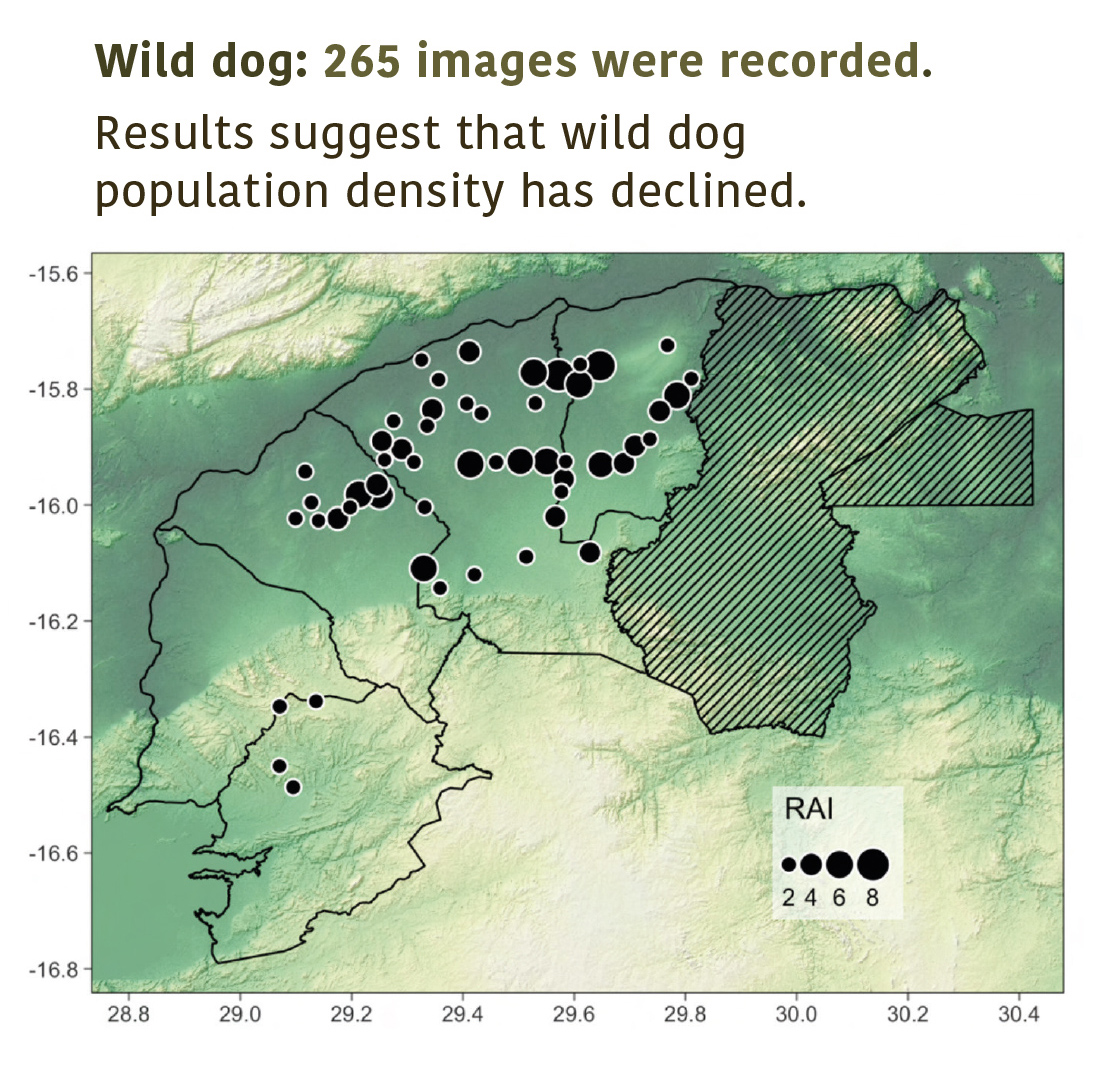
Initial findings from Charara, Mana Pools National Park, Nyakasanga, Rifa and Sapi in the 2022 dry season have been analysed and published in a report (available here), which includes density estimates of lions, leopards, and wild dogs. The maps featured here show the relative abundance (RAI) distribution of particular species. RAI is a standardised measure of detection rate and can tell us how often a species was detected at a particular site.
Watch this space for news on Chewore and Dande Safari Areas coming soon…