Research
KAZA Connectivity Model Outputs
KAZA TFCA – Landscape connectivity modelling
KAZA connectivity model outputs
Landscape connectivity in Botswana
Landscape connectivity in Zimbabwe
Based on the model’s outputs the following key recommendations have been proposed to maximise connected habitat for lions and other wildlife in the KAZA region. It should be noted that these are biological priorities that should be considered for incorporation into conservation management policies.
- The highest priority is to continue to manage and protect nationally designated protected areas (PAs). Outside PAs, the ‘core areas of connected habitat’ are critical for long term conservation of lions. Prioritisation based on the size and strength of the core connected areas, outside national protected areas, is indicated by numbers set in Figure 1. The Okavango-Hwange system, incorporating the Okavango Delta, Chobe, Hwange and Zambezi National Parks and adjoining wildlife management, forest and safari areas is the highest biological priority, followed by the Sebungwe- Zambezi Valley region and the Central Kalahari.
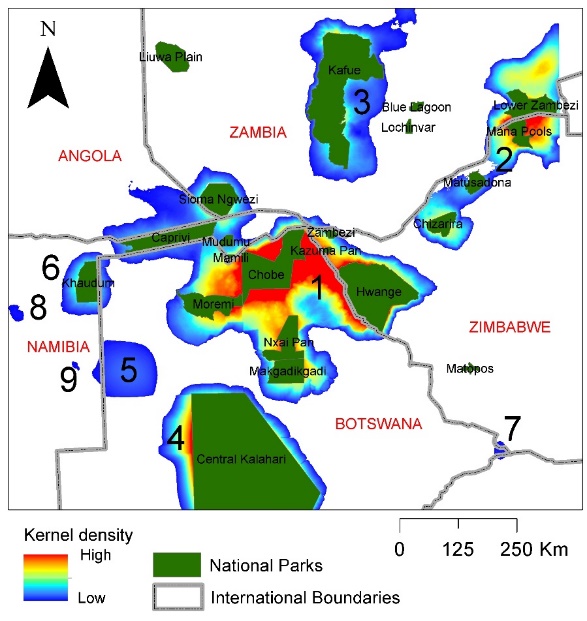
Fig 1. Ranked core connected habitat outside protected areas. Highest priority areas is shown as 1.
- ‘Movement corridors’ between core habitats allow population and genetic exchange between core areas and efforts to maintain these connectivity linkages should be encouraged to enhance connectivity. Biological prioritisations are given in Figure 2. The most important and third ranked corridors link the ‘Okavango-Hwange’ core area with the Central Kalahari. The second most important corridor links Hwange with the Sebungwe system to the North-East.
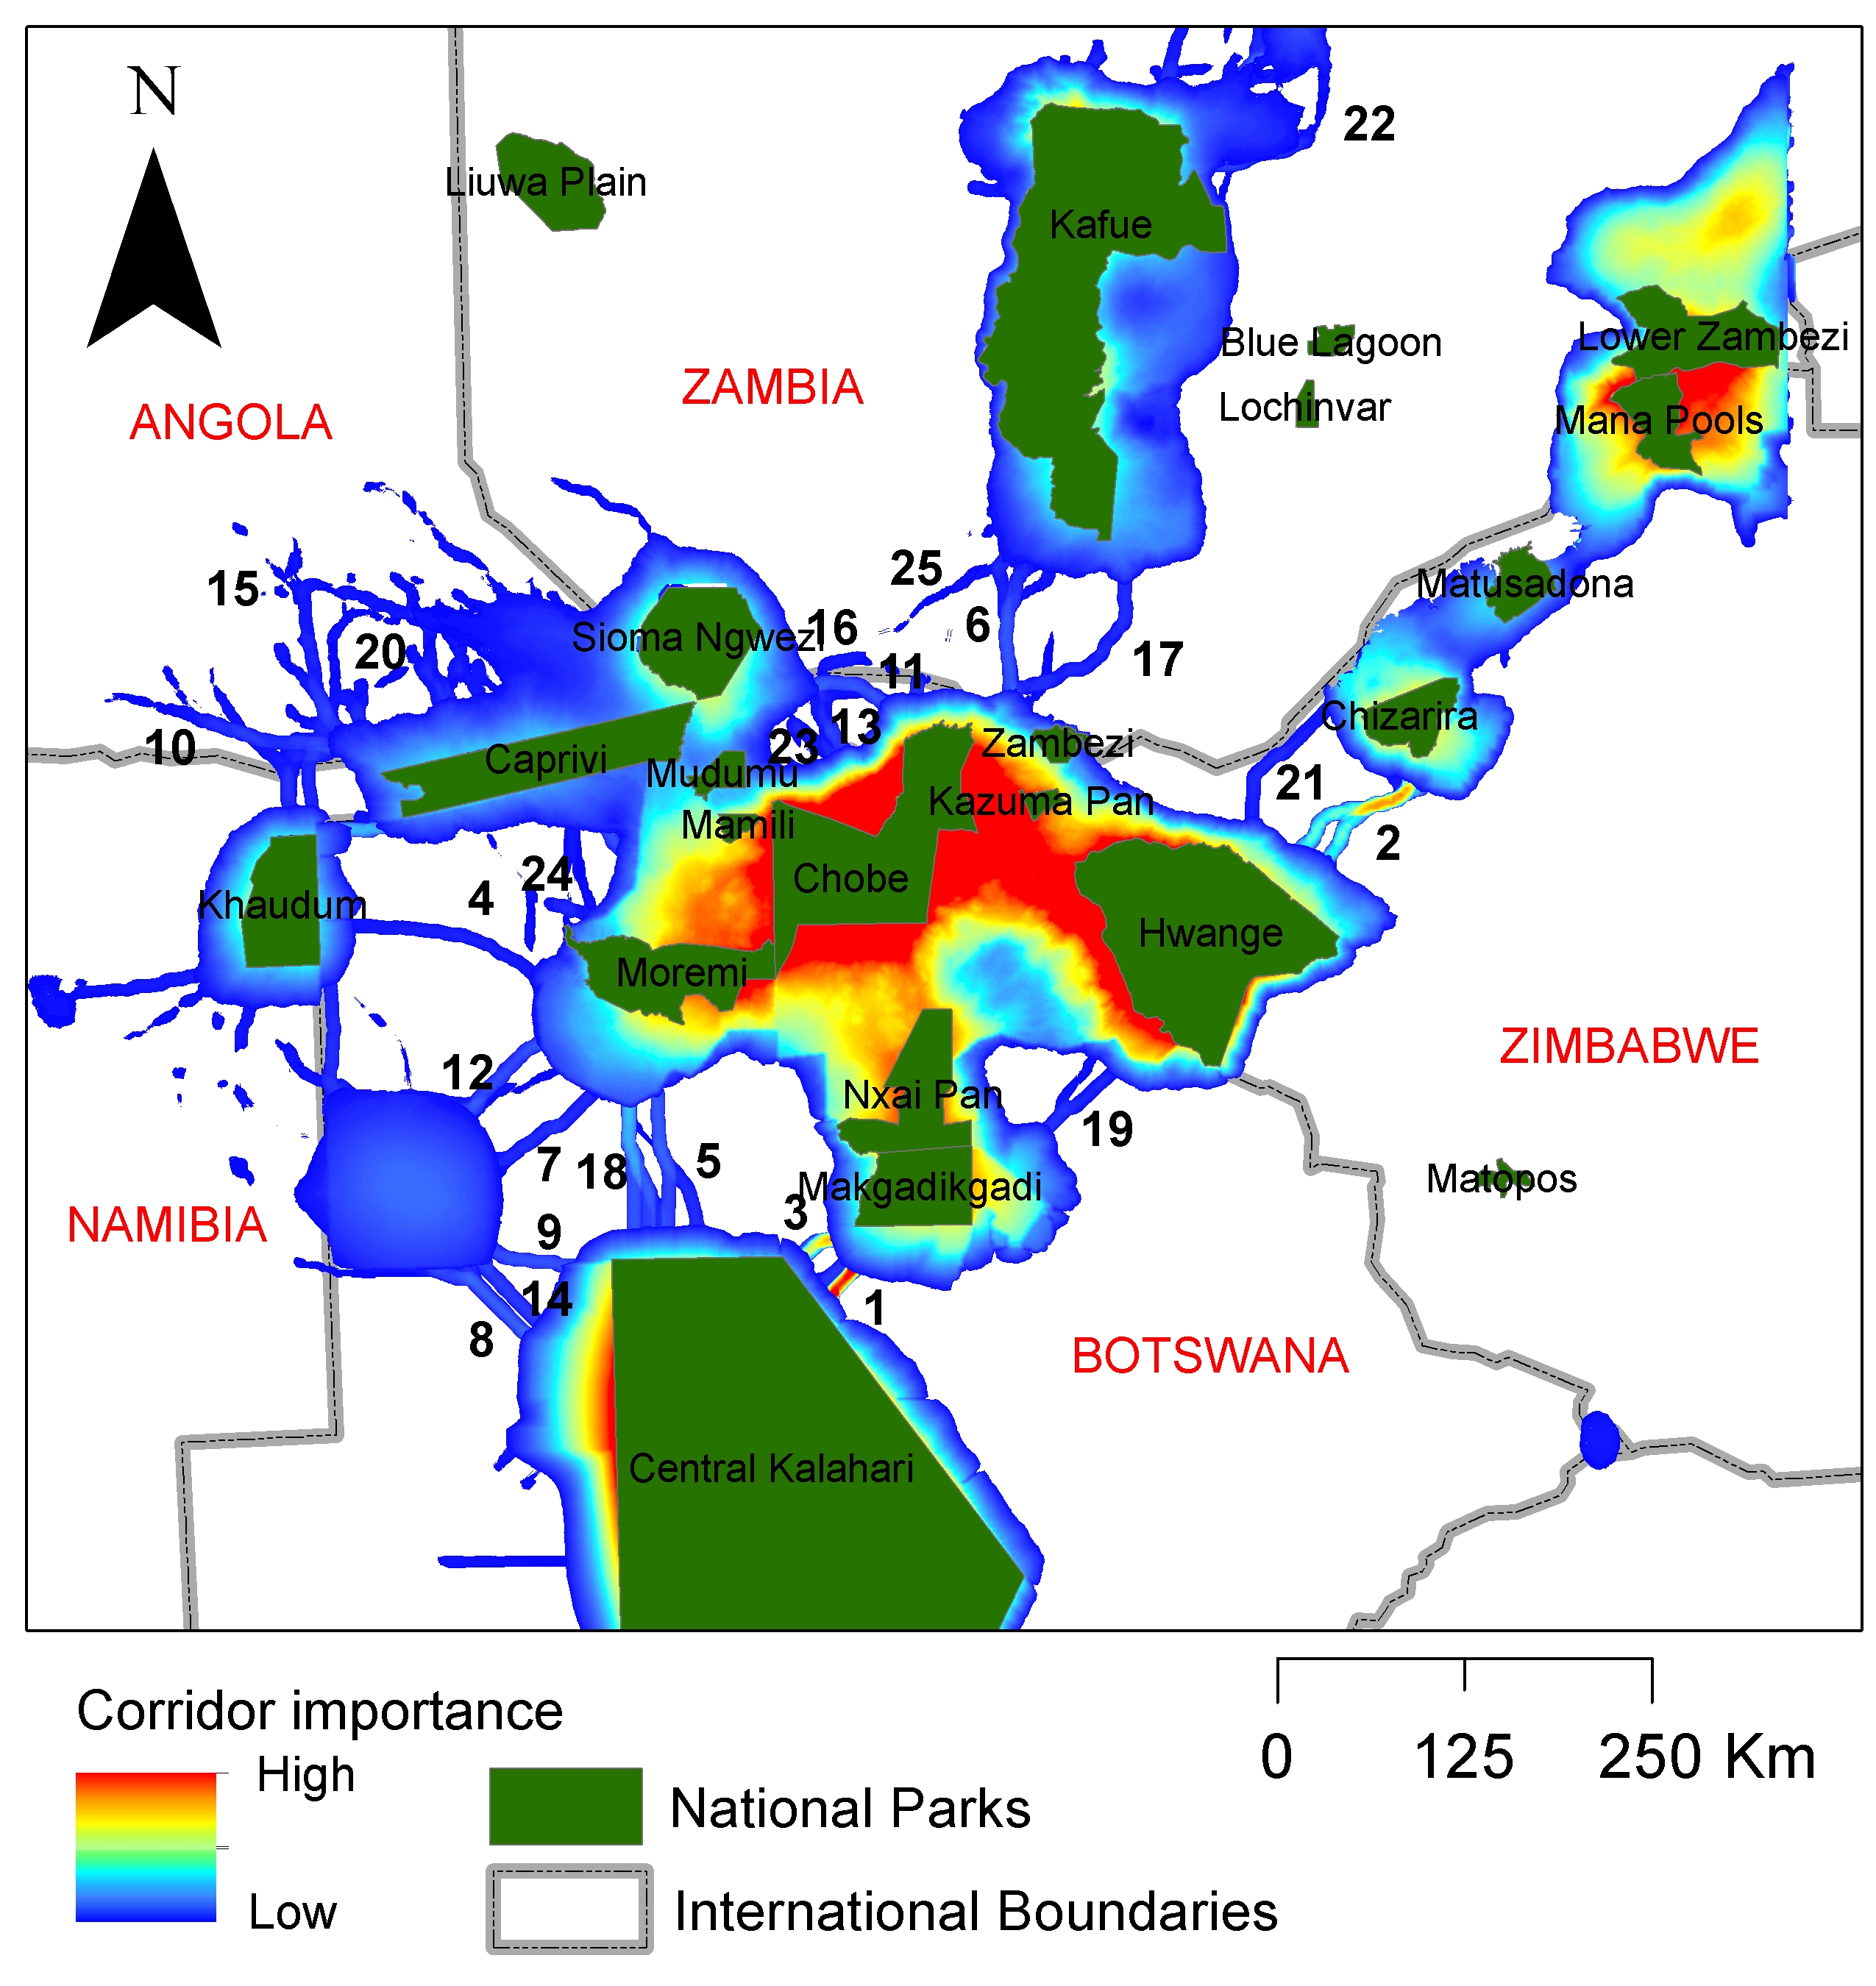
Fig. 2, Linkages and corridors between lion core areas outside national parks/game reserves (green) in and adjacent to the KAZA TFCA ranked by their relative strength and vulnerability, with the highest priority corridor given a ranking of 1.
- The model identifies and predicts potential conflict hotspots as areas where high probabilities of movement fall directly adjacent to areas of high landscape resistance (indicating high human population, development and infrastructure). These are prioritised according to the intensity of potential conflict (Figure 3).
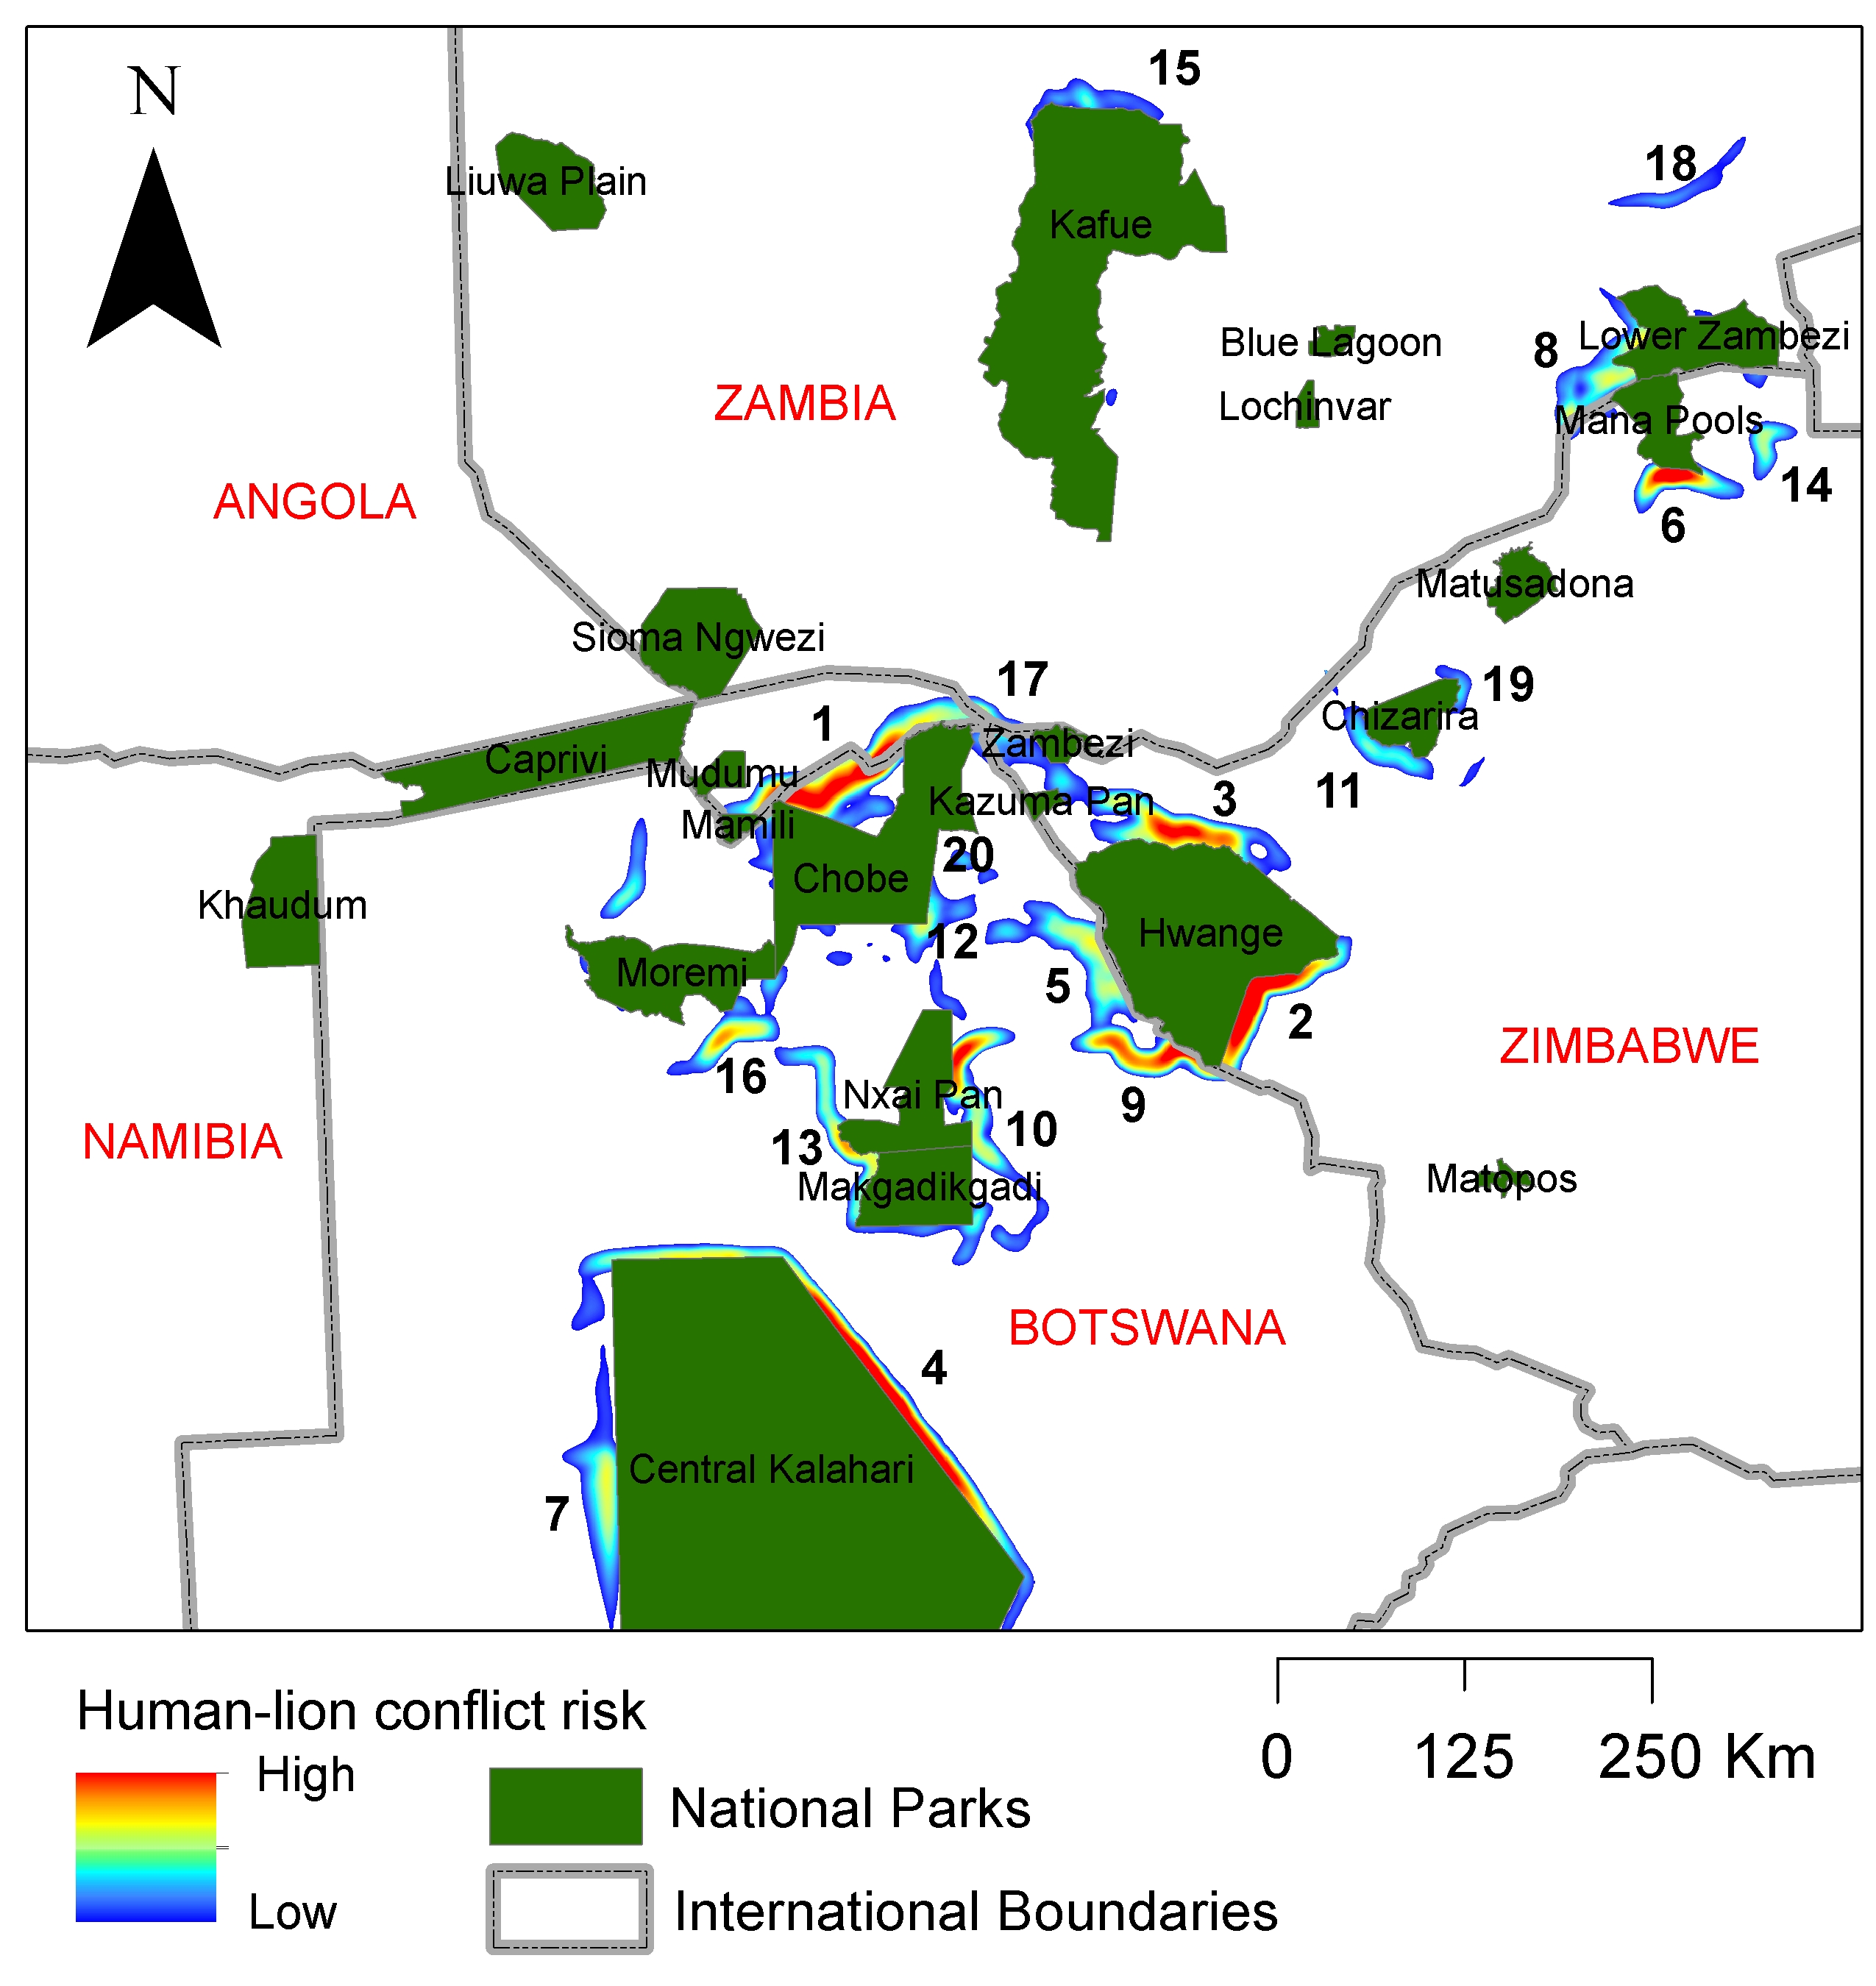
Fig. 3, Human-lion conflict risk in and adjacent to the KAZA TFCA ranked by their relative intensity with the highest risk area given a ranking of 1.
To aid uptake of the model’s outputs in land use management and decision making by regional and local policy makers in the KAZA TFCA a google Earth / GIS visualisation tool is available. These Google Earth layers can be downloaded:
Zimbabwe – https://www.wildcru.org/wp-content/uploads/2021/06/KAZA_connectivity_GIS_fin.zip
Botswana – https://www.wildcru.org/wp-content/uploads/2021/06/Botswana_connectivity_GIS.zip